All published articles of this journal are available on ScienceDirect.

How Does User Utilization of Traffic Information Impact a Transportation Network?
Abstract
Introduction
Advanced Traveler Information Systems (ATIS) provide real-time route and traffic data to drivers, allowing them to adjust travel based on shared insights. This study examines the factors influencing ATIS adoption and employs a Dynamic Traffic Assignment (DTA) model to evaluate varying levels of information access within the Bucaramanga Metropolitan Area.
Methods
To achieve this, surveys were designed to identify the variables affecting drivers' route choice behavior. Based on these insights, key variables for ATIS acceptance were defined, and seven DTA scenarios were simulated under specific assumptions of guidance acceptance or rejection.
Results
The results indicate that drivers primarily consult ATIS to avoid congestion, save time, and navigate unfamiliar routes. Consequently, utilizing this real-time information increases travel speeds and reduces incident-related congestion. However, a critical efficiency threshold emerged: performance improvements are strictly limited to a 0-30% acceptance rate locally and 0-50% network-wide. When over 50% of drivers act on ATIS guidance, overall network performance declines.
Discussion
This finding highlights the necessity of careful monitoring and strategic traffic management to prevent secondary congestion on alternative routes.
Conclusion
Ultimately, while providing real-time information effectively mitigates traffic incidents, the benefits of ATIS are non-linear. Maximizing urban network efficiency requires strategically managing information distribution to keep user acceptance within these optimal local and global thresholds.
1. INTRODUCTION
In Latin America, transport solutions have mainly focused on building and expanding roads. However, growing demand [1], budget limits, and environmental impacts make these measures unsustainable and inefficient [2, 3]. Consequently, transport planning has evolved with technological development, focusing on optimizing existing infrastructure and managing demand.
As part of technological advances in transportation and mobility, Advanced Traveler Information Systems (ATIS) play a key role. Built on Intelligent Transportation Systems (ITS), these tools provide drivers with real-time traffic information, helping them make informed travel decisions and creating a scenario close to "perfect information" [4-6]. ATIS technologies allow drivers to select alternative routes based on available information [7].
In developing regions such as Latin America, the implementation of these technologies has predominantly focused on basic traffic management systems, such as adaptive traffic signals, closed-circuit television surveillance, and ATIS supported by variable message signs (VMS) [8, 9]. Their deployment has largely been restricted to primary urban corridors and critical intersections. However, the impacts of traffic redistribution through alternate routes suggested by ATIS, as well as the potential benefits to the overall performance of the road network derived from drivers’ use of this information, remain largely unexplored and insufficiently quantified in the literature. Research tends to focus on broad adoption patterns or descriptive case studies, leaving important quantitative and behavioral dimensions insufficiently explored.
Key gaps in Latin American ATIS research include the lack of solid quantitative evidence on how traveler information shifts demand across routes, times, and modes; the absence of behavioral models tailored to local conditions-ones that capture informal transit use, safety concerns, and socioeconomic diversity; and a limited understanding of impacts related to equity, safety, and long-term system performance. Integration with informal transit also remains largely unexplored, mainly because of scarce data and the inherently fluid, operator-driven nature of these services. Taken together, these gaps show that current ATIS evaluations tend to be more descriptive than analytical and rely heavily on behavioral assumptions borrowed from higher-income regions that do not align with Latin America’s mobility realities.
Drivers often rely on timely traffic information to adjust their routes and avoid congested road segments [10, 11]. While such adaptive behavior has the potential to alleviate traffic conditions, it also raises a critical concern: if a large share of drivers follow the same recommended alternative route, the expected benefits may diminish considerably, and congestion may simply be relocated rather than resolved. This paradox highlights the importance of analyzing system-wide impacts when assessing the effectiveness of traveler information systems.
Modeling the effects of ATIS on driver behavior, typically through dynamic traffic assignment (DTA) models, allows researchers to assess how traffic information influences route choices and congestion distribution [12–14]. Simulations indicate that accurate and reliable information can improve traffic flow and promote a more balanced use of the road network [15, 16]. Nevertheless, the positive impact of ATIS is limited when many drivers ignore recommendations or when alternative routes also become congested due to widespread compliance.
The main objective of this research is to quantify and analyze the effects of traffic redistribution and congestion reduction in a road network where drivers receive complete or partial information through ATIS technologies. The case study focuses on the metropolitan area of Bucaramanga. To achieve this objective, the factors influencing drivers’ intention to consult and use traffic information were first identified, along with their acceptance or non-compliance rates when such information is provided. Subsequently, different levels of information penetration-defined as the proportion of drivers in the network who receive and act upon traffic information to adjust their routes-were evaluated using a Dynamic Traffic Assignment (DTA) model.
The main contributions of this article are:
- Identification of the factors that influence drivers’ acceptance and use of traffic information provided through ATIS tools.
- The quantification of the impact of flow redistribution within a road transport network, and its effect on congestion, when drivers have complete or partial information about traffic conditions.
- The estimation of the maximum proportion of drivers in a network who should have access to, and act upon, traffic information in order to achieve a positive impact on congestion reduction through flow redistribution.
The remainder of the article is organized as follows: the next part presents a review of the relevant literature, followed by an explanation of the methodology used in this research. Afterwards, the article describes the characteristics and general information of the case study. The subsequent part discusses the results obtained from the case study and the application of different scenarios for drivers’ access to traffic information. The article concludes with a discussion of the findings, the main conclusions, and recommendations for future research.
2. LITERATURE REVIEW
Advanced Traveler Information Systems (ATIS) are technologies within Intelligent Transportation Systems (ITS) based on computing, communication, and information. They provide users with data on travel times on a network, available routes, location services, traffic incidents, road construction events, inclement weather, hazardous situations, warning messages, and other situations that may disrupt the expected behavior of a road network [17, 18].
2.1. ATIS for the Provision of Traffic Information
ATISs are designed to support trip planning by providing directions tailored to drivers' travel preferences while acquiring, analyzing, and delivering information that facilitates movement between origins and destinations. Common mechanisms for transmitting such information include radio, television, in-vehicle navigation systems, internet platforms, smartphone applications, and variable message signs (VMS) [2, 17]. These technologies can be classified according to the timing of their use into pre-trip tools-such as internet services, radio, and television which provide real-time information to support initial decisions on departure time, mode, route, and destination, and in-route tools, such as in-vehicle navigation systems and VMS, which deliver real-time updates that help drivers respond to incidents or changing traffic conditions during their trip [2, 19, 20].
Technologies used to provide information, such as variable message signs (VMS), broadcasting systems, mobile applications, and GPS navigation, have been developed and evolved, oriented towards real-time collection of traffic conditions in cities [21-23]. These technologies can determine the position of vehicles and transmit them to a vehicle tracking system, receivers incorporated into the global navigation satellite system, or triangulation through network provider cell towers. As a result, everyday technological devices such as smartphones or in-vehicle GPS systems generate and receive traffic information [24].
However, research also indicates that widespread adoption of some apps in smartphones can produce unintended consequences. For example, some researchers show through traffic simulations that when a large share of drivers follows app recommendations, congestion may shift to alternative routes rather than being alleviated, creating a “partial demand transfer” effect [25, 26]. Other authors examine the role of crowdsourced data from navigation apps in enhancing traffic resilience to adverse events, including extreme weather, highlighting the potential of real-time app data for network-level traffic management [27].
Beyond system-level impacts, smartphone navigation apps influence user behavior through perceptions of information quality, trust, and usability. Drivers’ adherence to app guidance is mediated by the accuracy, completeness, and presentation of route information [28], while [29] shows that generational factors, such as familiarity and perceived ease of use, affect adoption rates and reliance on apps. Furthermore, research on road safety leverages smartphone sensors in navigation apps to detect hard-braking events, demonstrating the integration of apps into safety monitoring systems [30]. Collectively, this body of work emphasizes both the transformative potential and the limitations of app-based navigation systems: while they can improve travel efficiency and provide critical data for traffic management, their widespread adoption may generate network-level congestion effects, highlighting the need for system-aware modeling and policy guidance.
Regardless of the delivery method, traveler information systems provide near-real-time updates on travel conditions, enabling drivers to optimize their routes. This information typically includes traffic volumes, incident locations, estimated travel times for alternative routes, and the anticipated distribution of vehicles across available options [31-33].
Other technologies are also used to collect transport data directly from road infrastructure. These include detectors or sensors embedded in the pavement [8, 34], as well as radars and road cameras, which measure traffic flows and speeds at intersections and at the entrances and exits of major highways or arterial roads [35-38].
2.2. ATIS and Driver Behavior when Providing Route Information
Drivers’ commuting decisions are influenced by road infrastructure conditions, personal preferences, and broader urban changes such as infrastructure improvements, demographics, or land use [39-41]. Road adjustments may occur immediately in response to incidents or gradually over time as traffic conditions evolve [42, 43].
In many cities, bus drivers receive real – time instructions through on-board devices, primarily aimed at maintaining regular intervals and ensuring reliable services for users [44, 45]. Compliance with these instructions is usually mandatory, as failing to do so results in fines [46] or negatively affects the overall performance of the transportation system [47]. Nevertheless, both internal and external factors can hinder bus drivers from following these guidelines. Internal factors include their willingness to comply with instructions and their driving experience, which may lead them to believe they do not need such instructions, while external factors relate to route conditions and the state of the bus they operate [48].
For private vehicle drivers, several studies have examined how traveler information systems influence driver behavior, particularly through mobile applications that provide traffic and road conditions updates [49-51]. These studies highlight how ATIS can improve driving safety and efficiency. However, other authors point out negative practices resulting from their misuse [52, 53], often linked to distractions caused by on-board devices or to the mass use of information that shifts traffic onto previously uncongested routes.
ATIS provides information both prior to and during trips, including travel times for alternative routes. Consequently, travelers' choices are influenced by variables such as the accuracy of the information, the degree of travel time uncertainty, the timing of its provision, and the communication medium through which it is delivered [54]. In this context, route choice is typically modeled as a rational decision-making process in which evaluate the available alternatives [55-57], identifies their attributes, and calculates the expected utility derived from each option in order to maximize the perceived benefit [51, 58].
According to [53, 59], travel information can be classified into three categories: experiential, descriptive, and prescriptive. Experiential information is based on memory and reinforced learning from past travel, descriptive information reflects current or anticipated traffic conditions, and prescriptive information consists of recommendations or suggested alternatives. This classification enhances the understanding of the factors shaping travelers’ responses to ATIS. Ultimately, however, route choice remains strongly dependent on driver behavior, since individuals make decisions according to their mobility needs, regardless of whether they rely on traffic information [60, 61].
In the study of driving behavior, Random Utility Theory (RUT) is the dominant framework for modeling travel behavior and route choice. It assumes that individuals choose the route that maximizes their perceived utility based on attributes such as travel time, cost, and reliability [62]. However, relying solely on fully rational decision-making overlooks important psychological and contextual factors. Concepts from bounded rationality highlight those drivers who often satisfice, rely on habits or heuristics, and may distrust or misinterpret real-time information, making their responses to ATIS less predictable [17, 63]. Extensions from behavioral economics, including prospect theory, further show that drivers weigh losses more heavily than equivalent gains and react differently depending on how information is framed. Together, these theoretical foundations provide a stronger basis for designing surveys that capture both measurable choice attributes and the cognitive, perceptual, and experiential factors that shape how drivers interpret and act on traveler information [64, 65].
Some research extends RUT to account for heterogeneity in information processing and learning. Some authors reviewed ATIS studies and highlighted that mixed logit models, an extension of RUT, capture individual differences in responsiveness to information, perceived reliability, and uncertainty [17]. Other researchers combined ATIS with experience-based learning models within a RUT framework and found that drivers gradually update their utility perceptions as they gain experience with system accuracy [66]. While RUT remains the foundation for most ATIS behavior models, the literature increasingly acknowledges its limitations when travelers face cognitive constraints, incomplete information, or habitual behavior-leading to hybrid approaches that incorporate bounded rationality or prospect theory.
Recent studies highlight that, beyond driver behavior, route choice using modern technologies is influenced by variables such as travel time accuracy [67, 68], costs, congestion levels [69], trip-specific characteristics like accidents or speed cameras [70], and socioeconomic factors [71, 72]. Other research emphasizes that user attributes-such as route knowledge, age, and trust in the reliability of information-shape the decision to accept or reject ATIS guidance [17, 51, 61, 73]. In particular, information about accidents, delays, and congestion significantly impacts route choice, especially when users can verify its accuracy, thereby strengthening confidence in these tools for future use [73].
Furthermore, users tend to consult information more frequently for routes they already know or use regularly, rather than for alternatives, and studies report a low willingness to pay for such services since users believe the cost is already covered by the applications they use [74]. However, when multiple travel alternatives exist with different estimated arrival times, drivers are more likely to consistently rely on ATIS information [75]. The identification of variables influencing travelers' route choices has underscored the need to model driver behavior and its effects on the network, and several approaches have been proposed to assess the value of information, including observed and calculated travel times, expected utility, and the perceived reduction of time costs and uncertainty [76, 77].
Nevertheless, few studies have examined the extent to which it is beneficial for both networks and users when drivers follow ATIS guidance, or how this behavior can help reduce congestion. This research, therefore, seeks to answer two questions: i) Which variables influence drivers’ willingness to consult and follow ATIS information? And ii) What is the optimal proportion of users that should follow real-time ATIS guidance to generate a positive impact on the transportation network?
3. MATERIALS AND METHODS
To identify the variables influencing route choice among drivers when using technologies that provide traffic information, this study surveyed private vehicle drivers in the Bucaramanga Metropolitan Area (AMB) in Colombia. This survey, in addition to identifying the variables that influence a driver's route selection, also sought to estimate drivers' acceptance or rejection of traffic information provided through ATIS-type tools.
3.1. Survey Design
It is important to note that no official secondary data is available to estimate the acceptance rate of traffic or route information, as no ATIS-related projects have been implemented to date in the metropolitan area of Bucaramanga. Currently, traffic information is provided only through radio, TV, web platforms, and mobile apps, but these channels are not used to support mobility-related decisions or policies.
Due to the lack of accurate and reliable data on ATIS use in the region, a survey was developed to understand users’ driving habits and the role of traffic or route information in their decisions, including cases where such information is not used. The key considerations for designing and administering the survey are presented below.
- Target population: adult drivers in the Bucaramanga metropolitan area, with a valid license, who drove a private vehicle (car or SUV) in the month before the survey.
- Sampling units: private vehicle drivers who use ATIS for their trips, private vehicle drivers who do not use or are not familiar with ATIS as a travel tool.
- Sampling type: non-probabilistic using a convenience sampling approach, due to the lack of a detailed sampling frame and the resources required for a probabilistic design.
- Data collection method: Structured, in-person interviews, with responses recorded by the researcher on a web-based survey form.
- Sampling frame: The study included drivers whose trips began and ended within the Bucaramanga metropolitan area. Since no database of eligible drivers was available, a traditional sampling frame could not be built. The sample was therefore defined using an inclusion/exclusion procedure to ensure representation.
- Inclusion/exclusion control: Drivers were randomly approached and included only if they had a valid license, drove light vehicles (car or SUV), and had driven during the month prior to the survey.
- Survey administration: In-person interviews conducted in high-traffic locations (parking areas, ADCs - automotive diagnostic center, and municipal transit offices in Bucaramanga, Girón, Piedecuesta, and Floridablanca). Drivers were informed about the study and invited to participate using a brief explanatory brochure and project website.
- Sample size: It was not possible to define an exact sample size because a non-probabilistic convenience sampling method was used, and no sampling frame existed. As a result, the sample size was determined by the number of drivers that could be surveyed within a 45-day data collection period. To establish a reference target, historical data on the vehicle fleet in the Bucaramanga metropolitan area were used. The average number of registered light vehicles from 2015 to 2019 (149,823 vehicles) was taken as the population, applying a 95% confidence level, 5% margin of error, and 50% response distribution. This produced an estimated target of 383 surveys. Even when considering an additional 10,000 vehicles registered outside the area but circulating within it, the estimated sample size remained essentially unchanged.
The following Table 1 shows the composition of the survey sample and the total population:
| n = 383 | % | N = 149.823 | % | Chi Square Goodness of Fit Test | ||
|---|---|---|---|---|---|---|
| Gender | Female | 175 | 46% | 65.002 | 43% | χ2 = 0,177 1 d.f |
| Male | 208 | 54% | 84.821 | 57% | p= 0,674 | |
| Age | < 21 | 18 | 5% | 10.488 | 7% | χ2 = 1,693 4 d.f p= 0,792 |
| 21 - 29 | 115 | 30% | 34.459 | 23% | ||
| 30 - 39 | 96 | 25% | 35.958 | 24% | ||
| 40 - 49 | 98 | 26% | 46.445 | 31% | ||
| > 49 | 56 | 15% | 22.473 | 15% | ||
| Driving Experience (years) | < 1 | 30 | 8% | 17.979 | 12% | χ2 = 2,629 4 d.f p= 0,622 |
| 1 - 3 | 120 | 31% | 49.442 | 33% | ||
| 5 - 9 | 89 | 23% | 29.965 | 20% | ||
| 10 -14 | 51 | 13% | 17.979 | 12% | ||
| > = 15 | 93 | 24% | 34.459 | 23% | ||
| Vehicle type | Car | 215 | 56% | 89.912 | 60% | χ2 = 1,986 2 d.f p= 0,115 |
| SUV | 168 | 44% | 59.911 | 40% |
A set of questions was then developed to identify the variables that explain drivers’ preferences and behavior when choosing routes in the Bucaramanga Metropolitan Area. The survey gathered information on driving habits, use and perception of traffic information apps, reasons and frequency of consultation, route-change behavior, and willingness to use or pay for such information. It also included sociodemographic data to characterize the sample.
Each variable of interest was defined with attributes such as the survey question, target population, coding, type, class, measurement scale, expected response range, and analysis method. Given the lack of official secondary data to estimate acceptance rates of traffic or route information, the survey incorporated items to capture users’ driving habits in the case study city, considering both the use and non-use of such information. The survey had three sections with 26 questions and an average completion time of 3–5 minutes. The first section, User Driving Habits, ensured respondents belonged to the target population (private vehicle drivers) and provided data on trip frequency and duration.
The second section, “User Behavior Toward ATIS”, examined the use of ATIS among drivers in the Bucaramanga Metropolitan Area (AMB), distinguishing between users and non-users to identify strategies that could encourage adoption. The third section, “General Information About Each Respondent”, collected sociodemographic data (age, socioeconomic status, education, and residence) to analyze driving behaviors within specific subgroups of the sample.
3.2. Survey Results
This section presents the most relevant survey results related to the queries that drivers make when using ATIS-type tools.
Drivers were asked which devices they use to access information about available routes for their trips. Figure 1 shows the percentage of responses in each category, indicating that participants have a broad understanding of the available query tools. Their knowledge is not limited to a single application; instead, they appear to rely on multiple platforms to obtain traffic information.
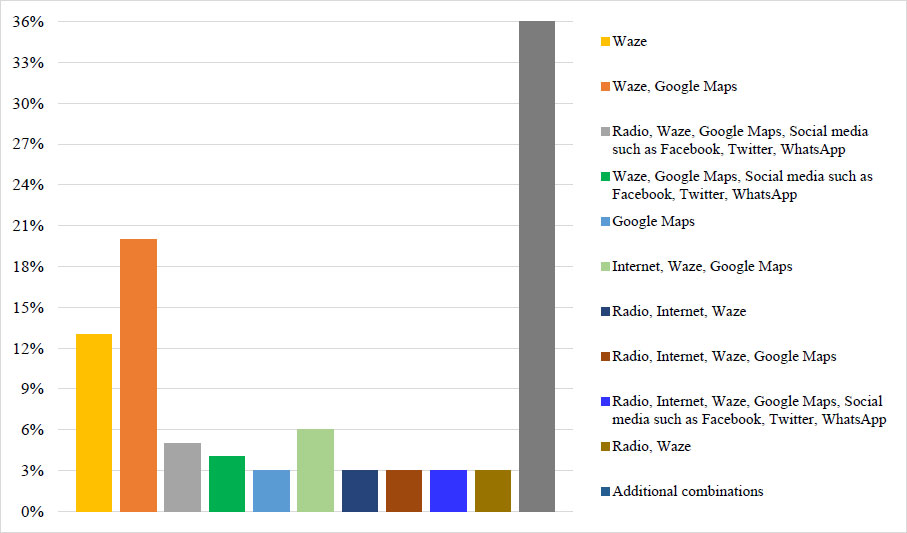
Main devices or applications used by respondents to obtain route information.
Figure 1 shows the percentage distribution of the different combinations of platforms and devices that drivers use to obtain route and traffic information. The most frequent responses were: ‘Waze and Google Maps’ (36%), ‘Waze’ alone (13%), and ‘Google Maps’ alone (20%). The remaining categories represent smaller combinations of tools-including radio, social media, and internet sources, with additional combinations reported.”
Subsequently, participants were asked how frequently they consult information about different routes when traveling. The results showed that 52% use this information less than half of the time they drive, 16% use it about half of the time, 16% always use these applications when driving, and 14% use the information more than half of the time they drive. The remaining 2% reported either not using this information when driving or selecting more than one option. Figure 2 shows the distribution of these responses.
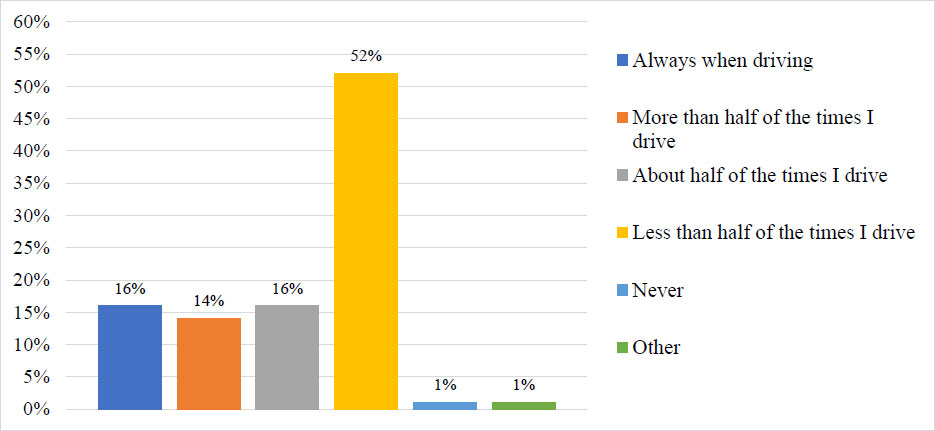
Frequency of information consultation among respondents.
Regarding the use of the information provided, it was found that as participants’ age increases, so does their tendency not to use route information. This behavior may be related to the difficulty older generations face in adapting to rapidly developing technologies. Figure 3 shows how the use of this information decreases as drivers’ age increases.
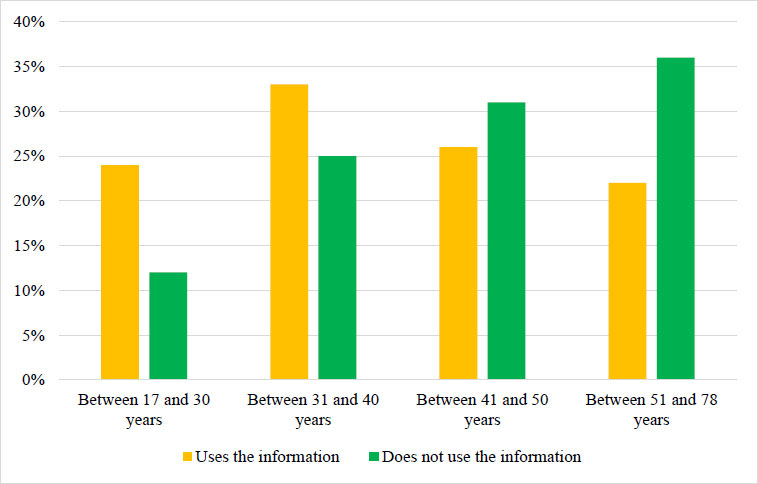
Use of information by age range.
Finally, drivers who reported not using ATIS information were asked why they do not use it. The responses are shown in Fig. (4). This figure shows that the most selected option was “not interested” (43%), followed by “does not know how to look up information” (25%) and “does not find it useful” (10%). In the “Other” category, respondents mentioned reasons such as not being aware of the information, not needing it due to knowing the routes, low traffic or short trips, using such applications only in larger cities, or lacking the means to consult the information.
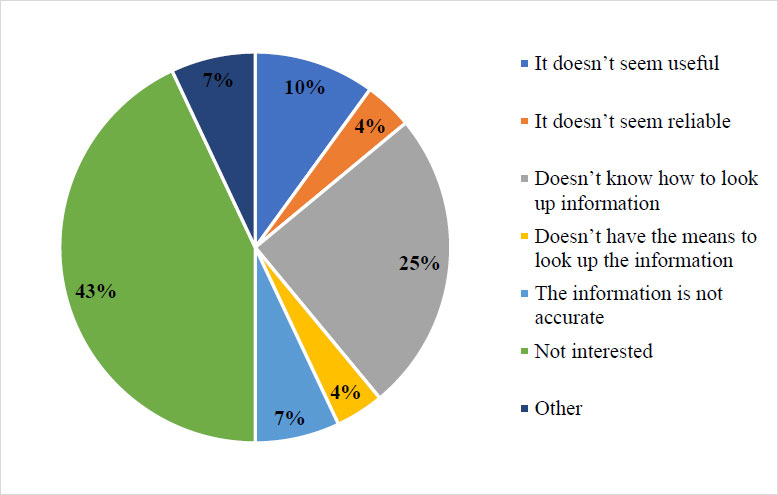
Reason for not consulting the information.
3.3. Scenario Analysis of Traveler Information Impacts on Travel Redistribution
The key variables for estimating drivers’ acceptance of route information were defined, and seven scenarios were established, each based on specific assumptions of acceptance or rejection, as summarized in Table 2.
| ITEM | Scenario Name | % of Acceptance | Considerations |
|---|---|---|---|
| 1 | Baseline | 0% | Assumes that no driver accepts the information. |
| 2 | Reference | 100% | Assumes that all drivers accept the information. |
| 3 | Medium | 50% | Based on responses to questions 4, 4.1, and 4.2, which explore knowledge of the application, interest in consulting traffic information, and actual use of the information. This scenario reflects variations among subgroups within the sample. |
| 4 | Optimistic | 87% | Derived from question No. 16, which analyzes the willingness to change routes and the reasons for doing so. This “medium” scenario assumes a higher acceptance rate by including respondents who currently do not use or are not aware of traffic information but expressed willingness to adopt it. |
| 5 | Realistic No. 1 | 29% | Based on question 9, incorporating the variable ” time of information consultation”. It assumes drivers accept and use the information on all or most of their trips. |
| 6 | Realistic No. 2 | 19% | Based on question 11, using the “Realistic No. 1” scenario as a reference but restricting acceptance to respondents who both use the information on most trips and perceived it as useful. |
| 7 | Realistic No. 3 | 37% | Based on question 12, assuming that traffic information is used exclusively by drivers who follow the traffic-related instructions on all or most of their trips. |
To define the acceptance rates shown in the third column (% acceptance), several scenarios were developed to evaluate different hypotheses based on the survey results. These scenarios were constructed by analyzing the behavior of the measured variables from respondents’ answers. Each scenario was examined individually to determine the importance of each variable and its contribution to the acceptance rates. This process allowed the researcher to identify the variables that shaped the scenarios and to assess different acceptance rates using descriptive information obtained from the survey.
To assess the impact of drivers’ acceptance of traffic information, thirty replicas of the main traffic simulation scenario were generated for the Bucaramanga Metropolitan Area. Traffic incidents were introduced between 6:00 and 7:00 pm to disrupt normal conditions, and information was delivered to users in varying proportions to evaluate its effects on mobility. These incidents were modeled in Aimsun [78, 79], by blocking selected sections of the network to replicate events such as accidents or stalled vehicles.
For the calibration of the base-scenario simulation model, a dynamic traffic assignment approach was used to estimate network conditions and capture congestion patterns over time and space. Two route-choice methods were evaluated: stochastic route choice (SRC) and Dynamic User Equilibrium (DUE) [80]. Because DUE assumes unrealistically that users have perfect knowledge of route costs, the SRC approach was selected. SRC accounts for imperfect information by distinguishing between perceived and actual travel costs and assumes equilibrium when no traveler can improve their perceived cost by switching routes.
Subsequently, measures were applied to analyze ATIS effects, including diverting vehicles through turn closures and informing users with variable message signs. This enabled route recalculations to avoid incidents. The model also incorporated different compliance levels with the proposed measures, which allowed the construction of acceptance scenarios (Table 2) and the assignment of acceptance rates to evaluate their impact on network performance under simulated incidents.
3.4. Analysis of Proposed Scenarios for Evaluating Traffic Information Supply
A descriptive statistical analysis was performed on the collected data, followed by a sensitivity analysis comparing the Main Scenario with the seven proposed scenarios. This made it possible to examine how input data influence model outputs and to identify the variables with the greatest impact [74]. Sensitivity analysis can follow local or global approaches; in this study, a local approach was applied to evaluate variations in a single input variable – the penetration rate of traffic information provided to drivers.
From the results, comparative tables and graphs were generated to assess differences across scenarios. The analysis focused on how varying levels of information acceptance affect network performance, particularly regarding speeds, average queue lengths, delays, and travel times.
4. CASE STUDY
The study was conducted in the Bucaramanga Metropolitan Area (AMB), which includes the municipalities of Bucaramanga, Floridablanca, Girón, and Piedecuesta, located in the northeastern part of Colombia. Figure 5 shows the AMB along with the specific locations where the survey was carried out. The survey was conducted in person, according to the drivers’ willingness to complete the form. The surveyors positioned themselves in locations with high concentrations of the target population, such as parking lots in commercial centers and districts, Automotive Diagnostic Centers (ADC), and Municipal Transit Offices located in the municipalities of Bucaramanga, Girón, Piedecuesta, and Floridablanca. These sites were selected because they increased the likelihood that the individuals present were drivers.
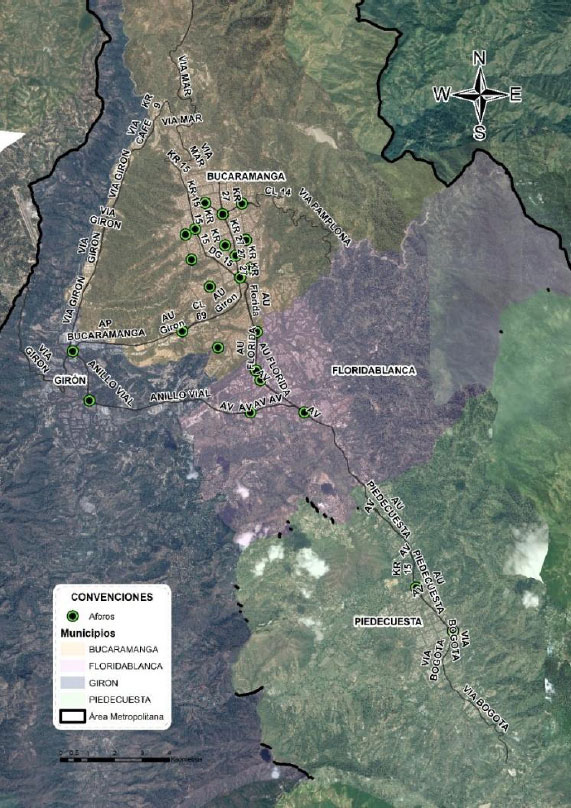
Survey location in the AMB.
The AMB has a population of 1.1 million inhabitants, of which 48% live in Bucaramanga, 25% in Floridablanca, 14% in Girón, and 14% in Piedecuesta. Based on data from the Origin-Destination Survey conducted for the Metropolitan Mobility Master Plan 2022–2037 [81], the spatial and temporal characteristics of the population's trips were identified. This allowed for a breakdown of total daily trips, as shown in Table 3. Bucaramanga is the main destination, as slightly more than 50% of the trips in the AMB are directed to this city, while the other three municipalities primarily function as bedroom communities within the metropolitan area.
| Destination | ||||||
|---|---|---|---|---|---|---|
| ORIGIN | Municipality | Bucaramanga | Floridablanca | Girón | Piedecuesta | Total Origin |
| Bucaramanga | 336.663 | 82.721 | 65.016 | 27.657 | 512.057 | |
| Floridablanca | 81.555 | 87.06 | 18.275 | 20.300 | 207.189 | |
| Girón | 53.210 | 17.154 | 44.374 | 15.811 | 130.548 | |
| Piedecuesta | 28.665 | 20.289 | 16.475 | 40.789 | 106.218 | |
| Total Destination | 500.093 | 207.224 | 144.140 | 104.557 | 956.012 | |
The most widely used mode of transportation in the AMB is the motorcycle, representing 34% of trips, followed by informal transport – such as ride-hailing apps (Uber, Didi, InDrive, etc.) and other modes including mototaxis, bicitaxis, and informal car services -with a share of 18%. This trend is consistent throughout the AMB, except in the municipality of Girón, where collective public transport accounts for a larger share compared to other modes (Fig. 6) [81]. Likewise, the vehicle composition during peak demand hours shows that 41% are automobiles, 47%, and the remaining percentage is distributed similarly between taxis, buses, and trucks (Fig. 7) [81].
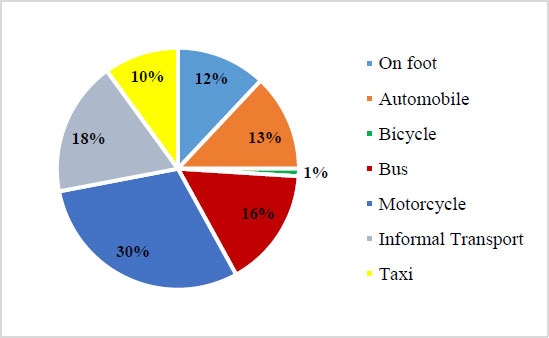
Modal share of daily trips in the AMB [81].
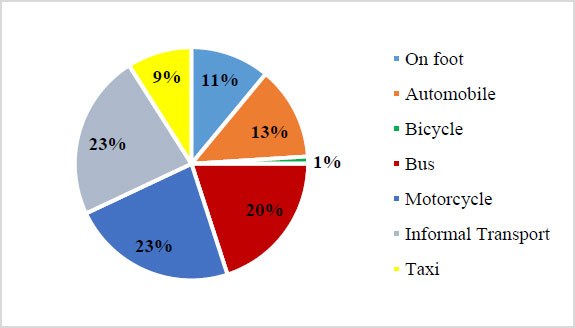
Modal share of daily trips in Bucaramanga [81].
5. RESULTS AND DISCUSSION
This section presents the results obtained and the analysis of the proposed scenarios, in order to answer the questions posed at the beginning of this article.
To address the first question, the results from the measurement and estimation of the user acceptance or disobedience rates regarding the provision of traffic information are presented. A total of 350 surveys were conducted, of which 93% of the responses collected were in optimal conditions for analysis, and the remaining 7% were excluded.
The survey revealed that 85% of respondents are familiar with the applications and/or devices, while the remaining 15% are not. Based on this, drivers who reported being familiar with these technologies were asked whether they use the information provided by the different applications and/or devices. Among them, 58% indicated that they both know about and use the information, while the remaining 42% do not. For respondents who either do not use the information or are unfamiliar with the technologies, a subsequent section explored the reasons for not using such tools. As a result, two subgroups were identified within the sample: one representing 49.7%, who reported both knowledge of and interest in using applications and/or devices to consult traffic information, and another group lacking both characteristics.
Participants who use ATIS applications were asked about the devices they are familiar with for searching for available route information. Most drivers reported using multiple sources to check route information. Waze was the most popular application, 73%, followed by Google Maps (63%), radio 37%, the internet (33%), and social media (26%). The main reasons for these consultations were to avoid congestion (71%9 and to reach destinations faster (61%). Others mentioned unfamiliarity with the route (32%), a habit of varying routes daily (9%), or simple curiosity (6%). In terms of frequency, just over half (52%) said they use this information less than half the time they drive, while smaller groups reported using it half the time (16%), most of the time (14%), or always (16%). Usage during trips also varied, with 44% relying on it occasionally, 28% frequently, 23% throughout the trip, and 6% not using it at all.
When asked whether they actually change their route after consulting traffic information, 25% said they always do, 33% occasionally, another 33% most of the time, and 9% never. The main reasons for changing routes were traffic congestion (61) and traffic accidents (52%9, as drivers sought better or safer alternatives. Others adjusted routes to save time (40%) or because they were unfamiliar with the destination (28%). A smaller group (11%) indicated no clear preference in their decision-making. Likewise, when asked about the timing of their route checks, 36% of respondents reported doing so at the start of their trip, 23% both before and during the trip, 21% during the trip, and the rest well in advance. Most participants (76%) found the information useful, while 24% considered it occasionally useful.
In terms of behavior, 50% of drivers reported following route instructions most of the time, 24% always, 16% about half the time, and 10% rarely. Regarding reliability, 70% considered the information reliable, 30% occasionally reliable, and just 1% viewed it as unreliable.
The results indicate that most drivers who use traffic information applications consider the data useful. Although the frequency of use varies, these users generally trust the recommendations and tend to follow them when they consult the information.
The link between the survey findings and the simulation results can be strengthened by highlighting how the primary motivation identified in the survey, “avoiding congestion,” is reflected in the modeled traffic redistribution. In the survey, most drivers reported consulting ATIS information specifically to avoid congested segments and reduce travel time. This behavioral tendency is directly incorporated into the Dynamic Traffic Assignment (DTA) model through the acceptance-rate scenarios.
In the simulations, when drivers receive information about an incident, those who “accept” the information (based on the acceptance levels derived from the survey) are reassigned to alternative routes with lower perceived travel times. This produces a measurable redistribution of flows away from the incident-affected segment. The improvements observed in speed, delay, queue length, and travel time-particularly in the 0–50% acceptance range-mirror the survey finding that drivers mainly use information to avoid congestion and are willing to change routes when they perceive a clear benefit.
These results formed the basis for building the scenarios and incorporating them into the simulation software. The model was applied through subnetworks for each municipality in the Metropolitan Area of Bucaramanga (AMB) to account for their specific mobility conditions. However, given the broad scope of the model, this article focuses on Bucaramanga, the largest and most influential city in the AMB, with the greatest population, road network, and urban infrastructure, and serving as the main trip attractor (Figs. 8 and 9) [81]. The following section presents the results and analyses for different levels of traffic information delivery to drivers.
Trip-attracting zones in the metropolitan area of Bucaramanga (AMB) [81].
Trip-generating zones in the metropolitan area of Bucaramanga (AMB) [81].
5.1. Main Scenario vs Scenario with Incident Implementation
The first analysis examined the impact of a road incident on traffic conditions by simulating an event that blocked a section of the network. In this scenario, users were assumed to have no information about the incident and thus continued along their usual routes. Based on the Main Scenario, the new simulation compared speeds, average queue, travel distance, travel time, and delays across the entire network, with a specific focus on the area directly affected by the incident.
5.1.1. Results from the Global Network-level Analysis
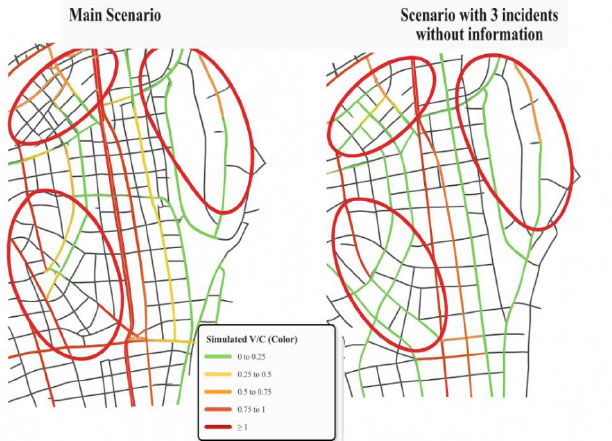
Figure 10 presents the simulated traffic flow for the studied network, comparing the Main Scenario (left) with the incident scenario without information (right). As shown in the legend, flow intensity increases from green to red, with red indicating a volume-to-capacity (V/C) ratio above 1. In the incident scenario, flow decreases near the affected segment due to the disruption, while some sections farther away experience increased flow.
Simulated traffic flow in bucaramanga under the main scenario and the incident scenario without information.
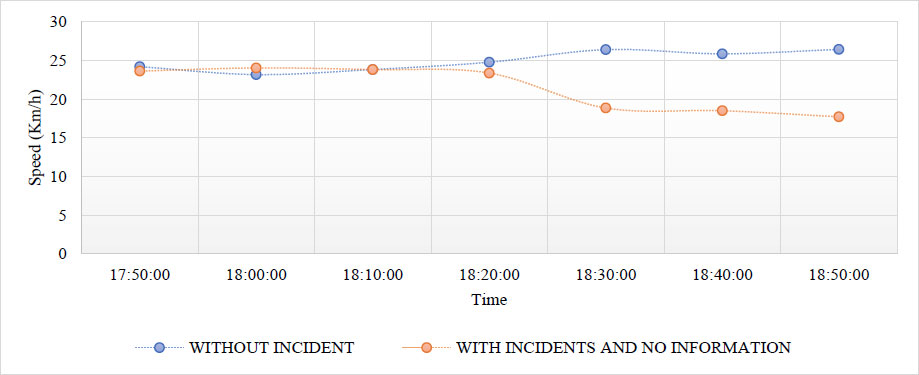
Figure 11 shows the speed trends between 6:50 p.m. and 7:00 p.m. for both the Main Scenario and the Incident Scenario without user information. In the Main Scenario (blue line), speeds generally decline over time, while the incident scenario shows a further decrease. Although average speeds during peak hour appear higher than real conditions due to the influence of uncongested segments, incidents still reduced average speeds by 3-5%. While these percentages may seem modest, they reflect the combined effect of three isolated incidents, suggesting a more substantial impact on network performance.
Average speed in bucaramanga under the main scenario and the incident scenario without information.
Similarly, an analysis was conducted on other variables. Travel time showed a steady increase in the Main Scenario, with even higher values in the Incident Scenario, about 7% more across the network (Fig. 12). Delay time, measured as the difference between expected and simulated travel time per vehicle per kilometer, also rose in both scenarios, but the Incident Scenario recorded a greater increase, averaging 10% above the Main Scenario (Fig. 13).
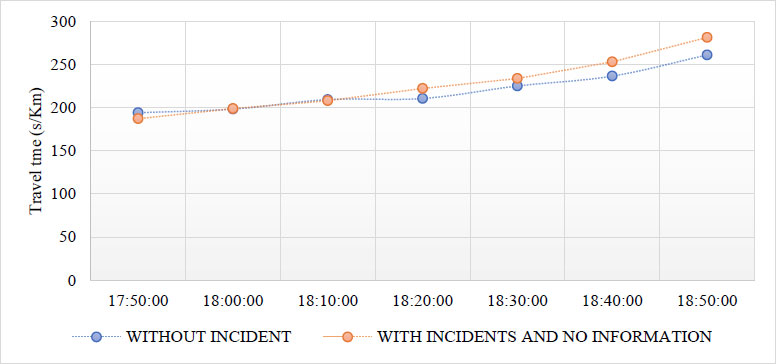
Travel time in bucaramanga under the main scenario and the incident scenario without information.
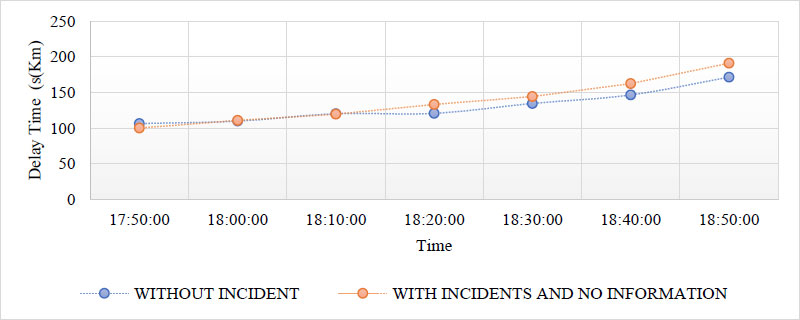
Simulation delay time in bucaramanga under the main scenario and the incident scenario without information.
The results show that simulated incidents negatively affect mobility across the entire network, a finding consistent with the expected behavior of urban transportation systems under real conditions.
5.1.2. Results for the Area of Influence of the Incident
After analyzing the network as a whole, the study focused on the local effects of incidents in Bucaramanga, where three simulated a highly congested intersection. Results for the area around Street 33 and Street 48, one of the city’s busiest points during peak hours, show that in the Mian Scenario, traffic flows remained within expected levels. In contrast, the Incident Scenario without user information produced reduced flow at the affected segments and increased volumes on surrounding roads, mirroring the trends observed at the network level (Fig. 14).
Simulated flow in the area of influence of the incident at street 33 and street 48 under the main scenario and the incident scenario without information.
Figure 15 shows that in the area of influence, average speeds in the Main Scenario remain around 25 km/h, while in the incident scenario without information, they drop to about 15 km/h, representing a 38% reduction.
Average speed at street 33 and street 48: main vs. incident scenario.
Other variables illustrating the degradation of mobility in the area of influence are shown in Figs. (16 and 17). Figure 16 highlights a 68% increase in delay times in the incident scenario, while (Fig. 17) shows a similar average rise of 68% in travel times.
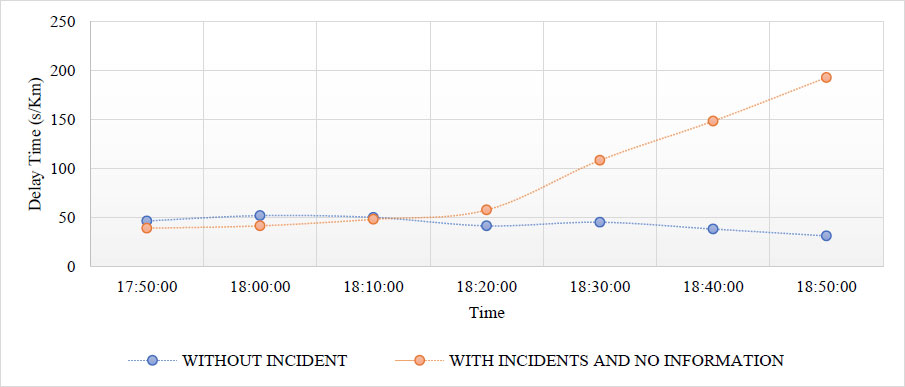
Delay time at street 33 and street 48: main vs. incident scenario.
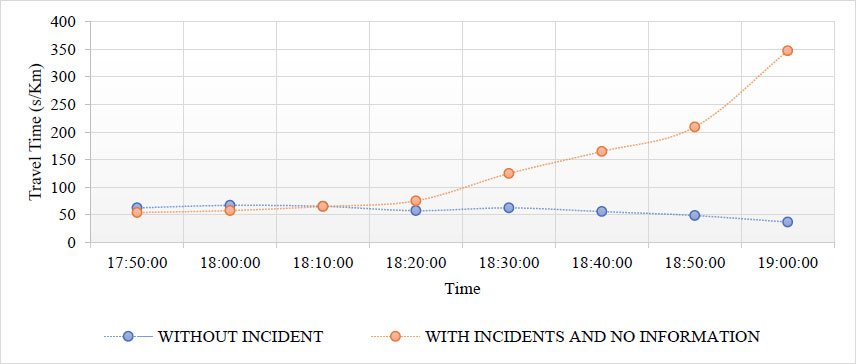
Travel time in the area of influence at the street 33 and street 48 intersection under the main scenario and the incident scenario without information.
5.2. Assessment of Proposed Traffic Information Penetration Scenarios
After identifying how incidents affect the transportation network at both global and local levels, seven scenarios were proposed to evaluate the impacts of drivers’ information within the simulated network of the Bucaramanga Metropolitan Area. Scenario 0 represents the Baseline Scenario, where traffic incidents occur under typical conditions without providing any information to users, corresponding to an information acceptance rate of 0%.
![]() Scenario 0 (Baseline) - Traffic information acceptance rate: 0%
Scenario 0 (Baseline) - Traffic information acceptance rate: 0%
![]() Scenario 100 (Reference) - Traffic information acceptance rate: 100%
Scenario 100 (Reference) - Traffic information acceptance rate: 100%
![]() Scenario 1 (Medium) - Traffic information acceptance rate: 50%
Scenario 1 (Medium) - Traffic information acceptance rate: 50%
![]() Scenario 2 (Optimistic) - Traffic information acceptance rate: 87%
Scenario 2 (Optimistic) - Traffic information acceptance rate: 87%
![]() Scenario 3 (Realistic 1) - Traffic information acceptance rate: 29%
Scenario 3 (Realistic 1) - Traffic information acceptance rate: 29%
![]() Scenario 4 (Realistic 2) - Traffic information acceptance rate: 19%
Scenario 4 (Realistic 2) - Traffic information acceptance rate: 19%
![]() Scenario 5 (Realistic 3) - Traffic information acceptance rate: 37%
Scenario 5 (Realistic 3) - Traffic information acceptance rate: 37%
5.2.1. Results from the Global Network-level Analysis
At the global network level, the simulated incidents in Bucaramanga resulted in lower travel speeds and higher delays and travel times. This scenario serves as the baseline for evaluating how different levels of traffic information provided to drivers influence travel demand behavior across the seven proposed scenarios.
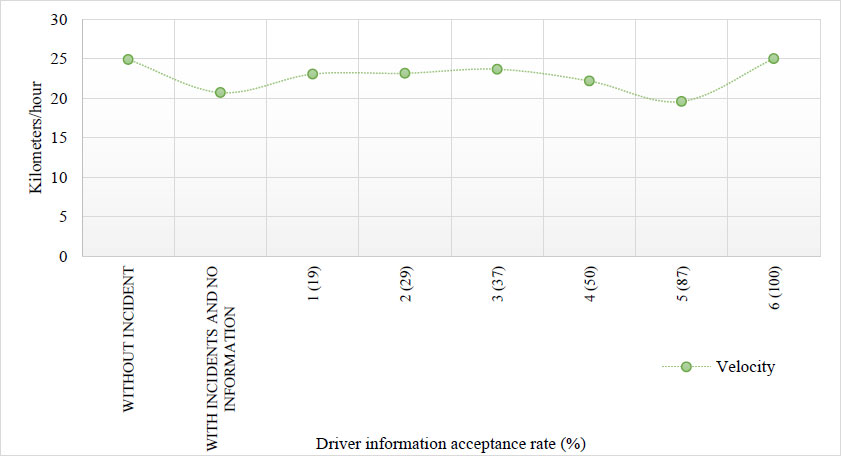
Figure 18 shows the main results. Compared to the Baseline Scenario, realistic Scenarios 1 and 2 show little change, with Scenario 2 yielding a 2.7% increase in average speed and Scenario 3 a 2.1% improvement. The Medium Scenario produced the largest gain (5.5%), followed by the Optimistic Scenario (4.6%) and the Reference Scenario (3.9%).
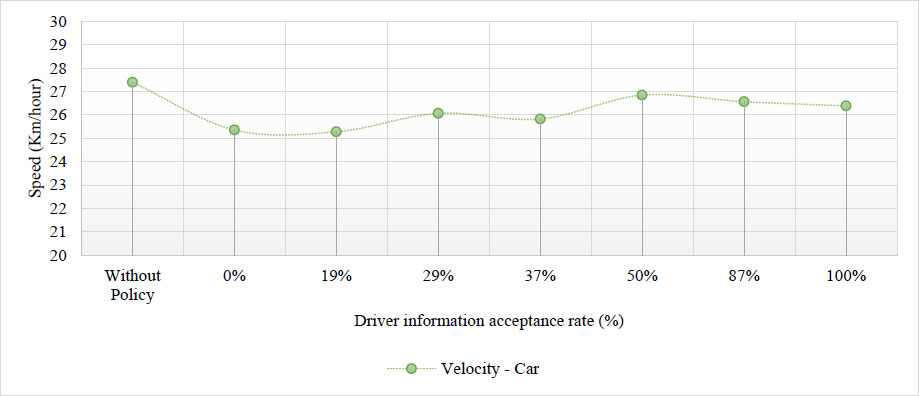
Average speed by percentage of traffic information acceptance in Bucaramanga.
The analysis shows that higher rates of information acceptance generally improve average network speed. However, beyond 50% acceptance, the benefits diminish. As noted by [7], this occurs when too many drivers follow the same recommended alternative route, creating secondary congestion-a phenomenon known as informational blocking. Additionally, suggested detours may lack the same capacity as the original route, causing congestion when volumes exceed their limits. Another explanation is that the suggested alternative route may have lower capacity than the original. When user volumes exceed this limit, travel times rise, creating new congestion points despite the intention to ease traffic.
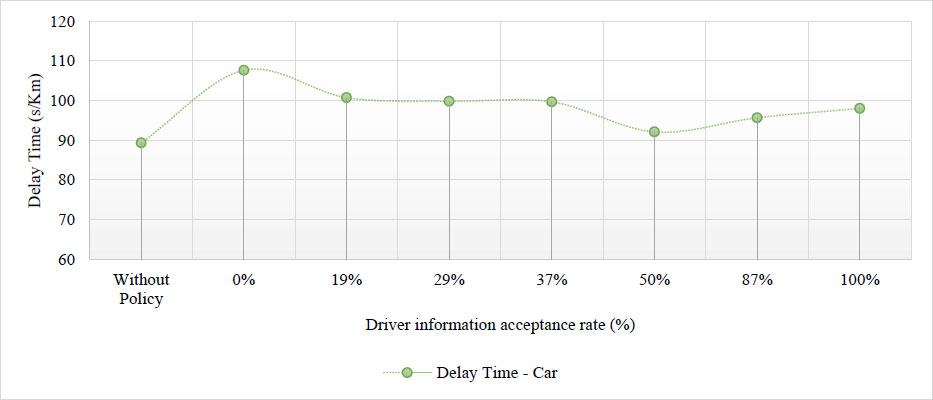
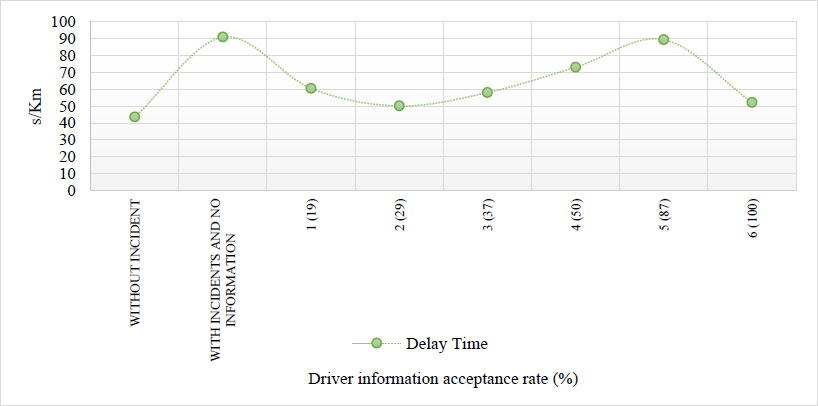
Regarding delay times, all scenarios show reductions compared to the baseline Scenario without incidents. For Realistic Scenario No. 1, 2 and 3 present decreases of 6.8%, 7.8%, and 8%, respectively. The Medium Scenario shows the largest reduction, with 17%. In contrast, the Optimistic and Reference Scenarios yield decreases of 12.5% and 9.8%, respectively.
Figure 19 presents the results for each scenario, showing a general trend of reduced delay times as the level of user information increases. However, after the Medium Scenario, the improvements begin to diminish, although the gains remain significant compared to the Baseline Scenario.
Delay time by percentage of traffic information accepted by users in Bucaramanga.
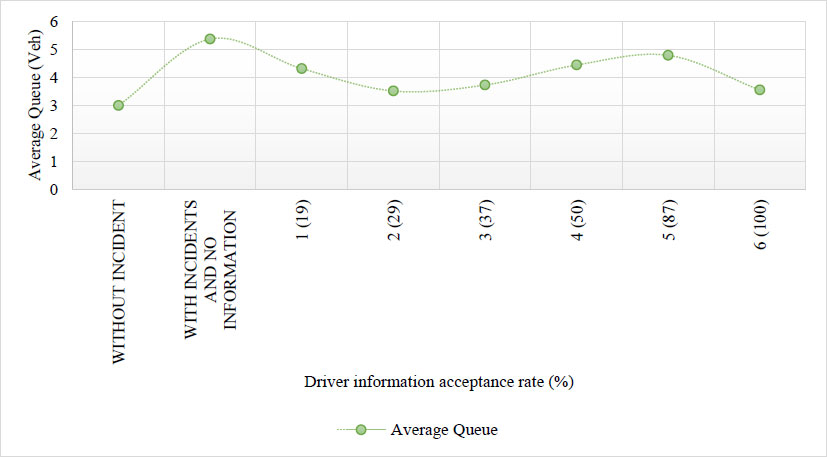
The average queue length decreased across all scenarios compared to the Baseline. Reductions of 8%, 7%, and 11.5% were observed in Realistic Scenarios No. 1, 2, and 3, respectively. The Medium Scenario showed the greatest improvement, with a 16.1% reduction, followed by the Optimistic Scenario (13.4%) and the Reference Scenario (9.4%). As shown in Fig. (20), average queue lengths decrease as the information acceptance rate increases. However, beyond the Medium Scenario, the additional reductions become less significant, even though improvements remain compared to the Baseline Scenario.
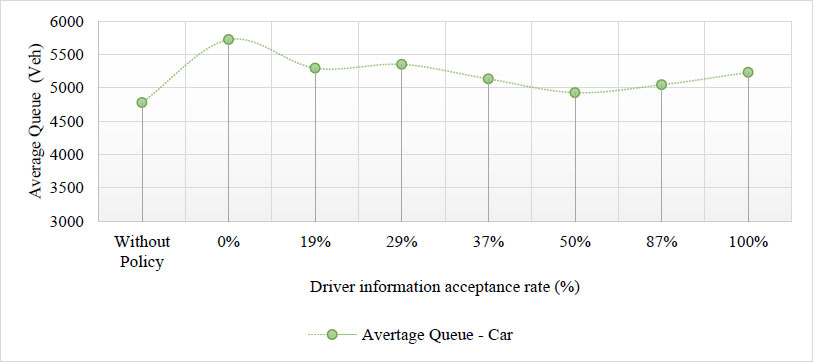
Average queue length by percentage of traffic information accepted by users in Bucaramanga.
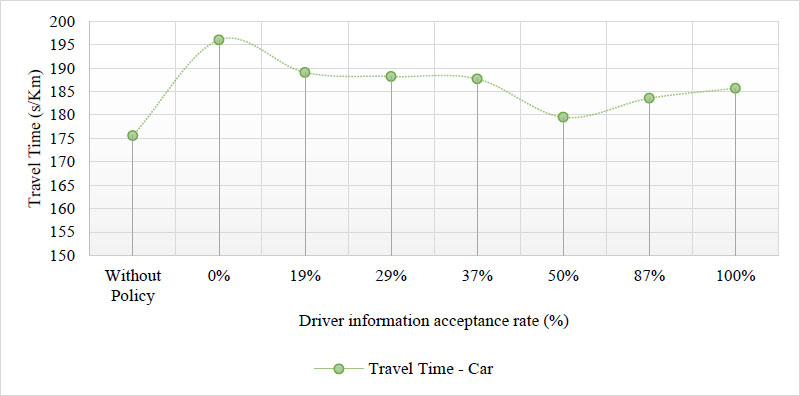
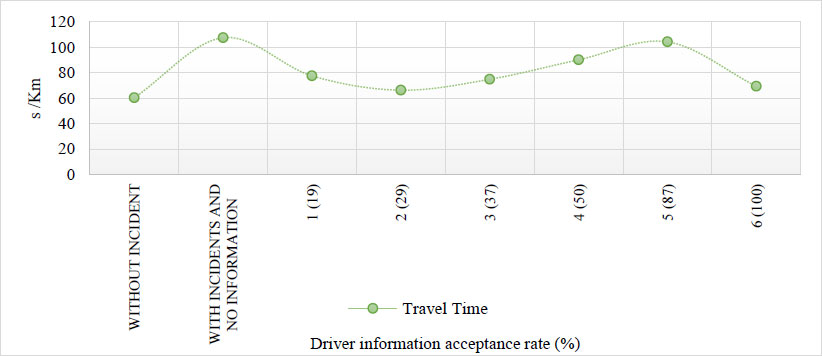
The analysis of travel times across scenarios shows that higher traffic information acceptance rates generally reduce travel times. Reductions were 3.7%, 4.1%, and 4.4% in Realistic Scenario 1, 2, and 3, respectively; 9.2% in the Medium Scenario; 6.8% in the Optimistic Scenario; and 5.6% in the Reference Scenario.
As illustrated in Fig. (21), travel times decrease as acceptance rates rise, but the effect peaks at the Medium Scenario. Beyond this point (Optimistic and Reference Scenarios benefits diminish once acceptance surpasses 50%, though improvements over the Baseline Scenario remain.
Travel time by percentage of traffic information accepted by users in Bucaramanga.
The analysis shows that both incident impacts and the dissemination of traffic information affect the entire network, with the resulting effects reflected in travel demand behavior. Providing users with traffic information improves overall mobility conditions, with the benefits increasing proportionally up to the Medium Acceptance Scenario. Beyond this point, however, the advantages diminish as acceptance rates continue to rise.
The previous results were obtained through a comparative analysis that involved constructing summary tables to organize the relevant information for further examination. Table 4 presents the aggregated network-level results for speed, travel time, delay time, and average queue length, considering the different vehicle types included in the model.
| Variable | Baseline Scenario (without incident)) | Level of Information Dissemination Regarding Incident Occurrence | ||||||
|---|---|---|---|---|---|---|---|---|
| 0% | 19% | 29% | 37% | 50% | 87% | 100% | ||
| Average Queue - All (Veh) | 8073 | 9819 | 8919 | 8675 | 8452 | 8321 | 8301 | 8618 |
| Average Queue - Bus (Veh) | 3081 | 3906 | 3467 | 3163 | 3181 | 3243 | 3115 | 3224 |
| Average Queue - Car (Veh) | 4854 | 5727 | 5298 | 5355 | 5137 | 4931 | 5049 | 5234 |
| Average Queue - Truck (Veh) | 138 | 186 | 153 | 156 | 134 | 147 | 137 | 160 |
| Delay Time - All (s/Km) | 130 | 143 | 139 | 131 | 129 | 126 | 121 | 131 |
| Delay Time - Bus (s/Km) | 247 | 267 | 270 | 242 | 232 | 243 | 209 | 248 |
| Delay Time - Car (s/Km) | 98 | 108 | 101 | 100 | 100 | 92 | 96 | 98 |
| Delay Time - Truck (s/Km) | 84 | 105 | 102 | 81 | 86 | 84 | 83 | 84 |
| Travel Time - All (s/Km) | 218 | 232 | 228 | 220 | 217 | 214 | 209 | 219 |
| Travel Time - Bus (s/Km) | 339 | 360 | 363 | 333 | 324 | 335 | 300 | 340 |
| Travel Time - Car (s/Km) | 185 | 196 | 189 | 188 | 188 | 180 | 184 | 186 |
| Travel Time - Truck (s/Km) | 155 | 176 | 173 | 152 | 157 | 155 | 154 | 154 |
| Velocity - All (Km/h) | 26 | 25 | 25 | 26 | 26 | 27 | 27 | 26 |
| Velocity - Bus (Km/h) | 25 | 24 | 24 | 25 | 25 | 25 | 26 | 25 |
| Velocity - Car (Km/h) | 26 | 25 | 25 | 26 | 26 | 27 | 27 | 26 |
| Velocity - Truck (Km/h) | 35 | 34 | 33 | 36 | 35 | 35 | 34 | 35 |
5.2.2. Results at the Incident Influence Area Level
An incident at the intersection of Street 33 and Street 48 was modeled to examine user behavior within the affected area. This baseline scenario showed a clear reduction in travel speeds, serving as the reference for comparisons with scenarios involving different levels of traffic information.
As shown in Fig. (22), average speeds improved by 8%, 7%, and 10% in Realistic Scenarios 1, 2, and 3, respectively. The Medium Scenario yielded a 5% increase, while the Optimistic Scenario produced a 7% decrease, indicating negative impacts when excessive information is provided. In contrast, the Reference Scenario, with 100% user access to traffic information, showed a 14% speed increase due to complete avoidance of the incident-affected segment, redistributing demand across unaffected routes. These results closely approximate the conditions of the Main Scenario without the incident.
Peed across scenarios by traffic information acceptance rate in the influence area of street 33 and street 48.
Regarding delay time, Realistic Scenario No. 1 shows a 50% reduction compared to the Baseline Scenario; Realistic Scenario No. 2, 21%; Realistic Scenario No. 3, 44%; the Medium Scenario, 19%; the Optimistic Scenario, 2%; and in the Reference Scenario, 74%. As shown in Fig. (23), delay times generally decrease as the information acceptance rate increases, with the largest reduction occurring at a 29% acceptance rate. Beyond this point, delays continue to decline, but the improvements are less pronounced. A similar pattern to that observed in the speed analysis also emerges: when all users have access to the information, delay times closely approximate the no-incident scenario.
Delay time across scenarios by information acceptance rate in the influence area of street 33 and street 48.
As shown in Fig. (24), average queue length decreased by 24% in Realistic Scenario No. 1, 53% in Realistic Scenario No. 2, 21% in Realistic Scenario No. 3, 12% in the Medium Scenario, and 51% in the Reference Scenario, compared to the Baseline. Improvements grow with higher information acceptance rates, peaking at 29%, after which gains become less pronounced. In the Reference Scenario, reductions are mainly explained by the exclusion of certain OD routes and the subsequent redistribution of demand.
Variation in average queue length across scenarios according to user information acceptance rates in the influence area of street 33 and street 48.
Figure 25 shows travel time behavior, which follows a pattern similar to the other analyzed variables. Reductions in travel time were observed as follows: 39% in Realistic Scenario No. 1, 62% in Realistic Scenario No. 2, 44% in Realistic Scenario No. 3, 19% in the Medium Scenario, 3% in the Optimistic Scenario, and 55% in the Reference Scenario.
Travel time across scenarios by user information acceptance rate in the influence area of street 33 and street 48.
The analyses show that user access to traffic information can mitigate the negative impacts of an incident on the network. Improvements are most significant at acceptance levels of 0–30% locally and 0–50% network-wide, mainly affecting OD routes that include the incident-affected segment.
The difference between the optimal penetration rates at the network level (around 50%) and the local level (30–37%) is mainly due to how the road structure and available capacity vary between the immediate incident area and the wider network. Near the incident, the surrounding roads have limited spare capacity and very few viable alternative routes. With about 30–37% of drivers rerouting, these nearby links can still handle the diverted flow and help improve speeds and reduce delays. But once that threshold is exceeded, the same diversion behavior overloads the small set of available alternatives, creating new congestion and reducing the overall benefit. In short, the local network reaches its limit much sooner.
At the metropolitan scale, the road system is more extensive and offers more routing options, higher-capacity corridors, and better distribution of demand. This allows the network to accommodate a larger share of informed drivers, up to around 50%, before congestion starts shifting and building up on alternative routes. Only beyond that point do the benefits diminish as demand becomes unevenly redistributed.
Overall, the different thresholds reflect the contrast between a highly constrained local network and a more flexible and interconnected metropolitan network. This is why the gains level off earlier in the incident area, while the broader system can sustain a higher percentage of informed drivers before performance begins to decline.
Finally, to validate the observed differences among scenarios, we conducted a one-way ANOVA and pairwise Welch t-tests with Bonferroni correction using 30 replications per scenario. Results confirmed significant differences in both travel time and delay across Baseline (0%), Realistic 3 (37%), Medium (50%), and Optimistic (87%) scenarios (Travel Time: F(3,116) = 44.94, p < 0.000001; Delay: F(3,116) = 32.01, p < 0.000001). Pairwise comparisons showed that Medium (50%) and Optimistic (87%) yielded significantly lower travel times and delays compared to Baseline (e.g., Travel Time difference for Medium vs Baseline = −7.91 s/km, p_adj < 0.001; Optimistic vs Baseline = −5.59 s/km, p_adj < 0.001). Differences between 37% and 50% were not significant after adjustment, consistent with diminishing returns beyond ~37%. These statistical results reinforce the conclusion that performance gains peak at penetration levels below 50%, supporting the proposed thresholds of 0–30% locally and 0–50% network-wide.
Table 5 below presents the ANOVA outcomes and pairwise t-test comparisons for Car Travel Time and Car Delay Time across the Baseline, 37%, 50%, and 87% scenarios.
| Comparison | Travel Time (p_adj) | Delay Time (p_adj) | Significance |
|---|---|---|---|
| Baseline vs 37% | 4.7e-05 | 0.08496 | TT significant |
| Baseline vs 50% | 0.000296 | 0.00279 | Both significant |
| Baseline vs 87% | 4e-06 | 1.5e-05 | Both significant |
| 37% vs 50% | 4.081207 | 1.303128 | Not significant |
| 37% vs 87% | 0.0 | 0.0 | Both significant |
| 50% vs 87% | 0.0 | 0.0 | Both significant |
Note: ANOVA Results: Travel Time F=44.94, p<0.000001; Delay Time F=32.01, p<0.000001.
CONCLUSION
The surveys conducted among users provided insights into the first research question concerning the factors that influence drivers to consult and follow the information from Advanced Traveler Information Systems (ATIS). Results indicate that most respondents use ATIS primarily to avoid congestion and reach their destinations more quickly. Additionally, a significant portion of users rely on this information due to familiarity with the areas through. A considerable percentage of individuals adjust their routes based on the information received, particularly when facing traffic congestion or road incidents that require alternative paths. These findings show that users perceive ATIS as a valuable tool for travel decision-making, with the main motivation being reduced travel time, followed by compensating for limited knowledge of travel routes.
The incident caused a decrease in overall network performance, with a much greater impact observed within the subnetwork surrounding the affected intersection. Based on this reference scenario, the seven information penetration scenarios were evaluated to assess the benefits or negative effects of providing users with traffic information through ATIS, both at the global network level and within the incident’s direct influence area.
To address the second research question, results indicate that traffic information is most beneficial when the user acceptance rate is below 50%. Above this threshold, benefits in delay time, average queue length, and travel time begin to decline, although they remain better than the Baseline Scenario. Positive outcomes are primarily due to the redistribution of traffic flows to alternative routes enabled by real-time information. When acceptance exceeds 50%, simultaneous use of suggested routes can overload these segments, reducing the effectiveness of the information and potentially increasing travel times.
In the incident’s direct influence area, local network behavior differs slightly from the global network. Travel speeds increase with higher information acceptance, peaking at Realistic Scenario No. 3 with a 10% gain, but decline in scenarios with higher acceptance, especially in the Optimistic Scenario. Delay time, average queue length, and travel time show similar patterns, improving most in realistic scenarios but worsening above 37% acceptance. When 100% of drivers are informed, all variables return to near pre-incident levels as traffic is fully redistributed away from affected routes.
The analyses indicate that providing information to users can mitigate the negative effects of an incident, but performance improvements are limited to 0-30% acceptance locally and 0-50% network-wide, with declines beyond these thresholds. Supporting studies, such as those by [6, 7, 13, 82, 83], show similar patterns, with speed reductions at low acceptance rates and improvements above 50%. However, these outcomes depend strongly on large-scale implementation of Advanced Traveler Information Systems (ATIS) [62, 83].
The reduction in benefits beyond a 50% penetration rate results from the interaction between driver behavior and network limitations. When many drivers receive the same information, they tend to react similarly and divert toward the same routes. This creates a form of herd behavior that reduces route diversity and concentrates demand on the alternatives suggested by the system.
From a network perspective, these synchronized diversions quickly saturate the available detour routes, which typically lack the capacity to absorb large redirected flows. As these links become overloaded, new bottlenecks emerge, and the expected gains disappear, a phenomenon known as informational blocking. In essence, too many informed drivers acting in the same way overwhelms the network's limited redundancy, causing benefits to level off or decline once penetration exceeds 50%.
The results indicate that providing traffic information through ATIS can yield benefits; however, it remains unclear what level of information acceptance in the market is most desirable, and predicting travelers’ responses with certainty is not possible. However, based on this evidence, traffic authorities could adopt a managed information dissemination strategy, in which real-time guidance is selectively targeted rather than broadcast uniformly to all users. This could involve prioritizing information for drivers located farther from the incident, staggering the release of detour recommendations, or using probabilistic or personalized messaging to avoid synchronized route shifts. Additionally, monitoring penetration levels in real time would help ensure that information does not trigger saturation effects on the detour network.
To strengthen the practical implications of this study, the discussion on differential local and network thresholds can be translated into concrete policy guidance. Results indicate that performance gains from Advanced Traveler Information Systems (ATIS) peak when information penetration remains below 30–37% in the immediate incident area and 50% at the network level. Beyond these thresholds, benefits diminish due to synchronized rerouting and congestion on alternative links-a phenomenon known as informational blocking. Therefore, traffic authorities should consider controlled dissemination strategies rather than uniform broadcasting. Recommended measures include: (i) geographic targeting, prioritizing drivers located farther from the incident; (ii) staggered release of detour recommendations to avoid simultaneous diversions; (iii) personalized or probabilistic messaging to promote route diversity; and (iv) real-time monitoring of penetration rates to maintain them within optimal ranges. These actions would maximize ATIS benefits while mitigating adverse effects, aligning information management with the actual capacity of the network.
For future research, it is recommended to analyze scenarios using a fully randomized and controlled provision of information, compared to an information supply based on probability distributions. Such analyses would help quantify the extent to which traffic information contributes to positive outcomes.
AUTHORS’ CONTRIBUTIONS
The authors confirm their contribution to the paper as follows: M.S.: Conceptualization; Y.M.E.: Investigation; C.B.: Writing-Reviewing and editing. All authors reviewed the results and approved the final version of the manuscript.
LIST OF ABBREVIATIONS
| ATIS | = Advanced Traveler Information Systems |
| DTA | = Dynamic Traffic Assignment |
| ITS | = Intelligent Transportation Systems |
| VMS | = Variable Message Signs |
| RUT | = Random Utility Theory |
| SRC | = Stochastic Route Choice |
| DUE | = Dynamic User Equilibrium |
| ADC | = Automotive Diagnostic Centers |
ETHICS APPROVAL AND CONSENT TO PARTICIPATE
The paper was reviewed and approved by the Scientific Research Ethics Committee – CEINCI (Comité de Ética en Investigación Científica) at the Universidad Industrial de Santander, located in Bucaramanga, Colombia. The authorization number from the ethics committee is: Acta No. 09 of May 24, 2019, from CEINCI-UIS.
HUMAN AND ANIMAL RIGHTS
All procedures performed in studies involving human participants were in accordance with the ethical standards of institutional and/or research committee and with the 1975 Declaration of Helsinki, as revised in 2013.
AVAILABILITY OF DATA AND MATERIALS
The data supporting the findings of the article is available in the Universidad Industrial de Santander repository at https://correouisedu-my.sharepoint.com/:f:/g/ personal/claudia2178169_correo_uis_edu_co/Eizdk-H8xux AvzWTVzPYsvIBPRiiLvINVdYbk6l1jMs7dg?e=F8tJLM.
ACKNOWLEDGEMENTS
Declared none.