All published articles of this journal are available on ScienceDirect.

Empowering Communities In Transformative Transport Decision-making: A Participatory Spatial Approach to Select Vulnerable Facilities for Citizen Sensing
Abstract
Introduction/Background
This paper presents the first steps of the BEC2SCHOOL project, aimed at providing communities and policy-makers with methods and tools to enhance public participation in transport decision-making and foster the co-design of sustainable mobility solutions, taking advantage of smart technologies and data.
Materials and Methods
The methodology to select the most suitable facilities to be involved in the project is presented. In particular, it consists of the choice of the criteria to be selected based on different features, such as the presence of infrastructures for cycling and pedestrian mobility and users’ exposure to traffic externalities. These criteria are used for a spatial analysis aimed at identifying the priority of interventions and paving the way for the next steps of the project.
Results
The main results show that traffic is considered the most important critical issue, and many schools show a medium-high level of vulnerability according to the selected criteria.
Discussion
Results pave the way for further analyses that are needed to select the most suitable facilities where traffic and environmental sensors will be installed.
Conclusion
A bottom-up participatory approach will be set up, involving educational facilities and providing their users with tools to collect traffic and environmental-related data, analyze the relevant impacts and propose proper solutions to policy-makers in order to tackle the mobility challenges.
1. INTRODUCTION
Urban transport planning has evolved over the last few decades to reflect the new sustainable mobility paradigm, by focusing on increasing accessibility rather than mobility and on the concept of “planning for people” [1]. Accessibility evaluates the extent to which land-use and transport systems enable users to reach activities by different transport modes, implying equal access for different groups within society, thus a reduction of social exclusion [2-4].
Planning for sustainable urban mobility implies a shift from a top-down technocratic approach to a bottom-up participatory one, where citizens and stakeholders are directly involved in the decision-making process [5]. According to Arnstein’s ladder of citizen participation, there are several levels of growing involvement, up to citizen control, when “participants or residents can govern a program or an institution, be in full charge of policy and managerial aspects, and be able to negotiate the conditions under which ‘outsiders’ may change them” [6]. It is important to define the level of engagement before the beginning of any planning process. However, participation is usually not well structured and conducted in a merely formal manner (e.g., through information events with low attendance). To have an active role in the decision-making process, citizens should be empowered. There are different methods and tools that can be used to support participation, tailored to specific stakeholder groups [7, 8]. In this respect, new technologies can help in the implementation of these processes, providing citizens and stakeholders with data-based knowledge to better understand the challenges of the current scenario and allowing them to propose feasible solutions to address them [9, 10]. It is therefore important to ensure that citizens also possess sufficient digital literacy to understand the information provided by technological tools.
Sensor data are important to monitor key performance indicators that are useful both in the planning and in the monitoring phase. They are typically environmental and traffic-related and they should be ubiquitous to have a clear overview of the system state in the context of smart cities. However, usually, cities lack adequate sensor coverage. More frequently, specific locations are monitored, and results extended via models [11]. Sometimes, citizens take the initiative to install sensors to report on specific problems and protect vulnerable users [12].
In this respect, educational facilities can be considered as highly risky places where citizen sensing can be successful. School students are usually classified among the road vulnerable users, mainly due to their age and the fact that they generally do not have access to private transport, except as passengers. Besides, young people are generally enthusiastic adopters of innovative and technological solutions [13]. Finally, schools are autonomous communities where they can evaluate their mobility needs, which may differ from those of other citizens. In this respect, schools usually have their own Mobility Manager, introduced by law in Italy (Law 28 December 2015, n.221) whose role is to improve the mobility habits of students and employees by reducing private car trips. Hence, sustainable mobility becomes an educational goal starting from primary schools.
The BEC2SCHOOL project (Funded by the Italian Ministry of University and Research under the PRIN 2022 PNRR Programme) aims to foster the development of bottom-up approaches in the decision-making process of sustainable urban mobility solutions. The project will empower citizens and in particular the youngsters, with tools to collect and analyze data related to traffic and environmental pollution and co-create urban mobility solutions. The main steps of the project include: (i) identifying vulnerable facilities, (ii) selecting low-cost sensors to be installed in the selected facilities, (iii) collecting and monitoring traffic and environmental data, (iv) fostering the co design of solutions to be presented to public policy makers.
This paper focuses on the first step of the project, i.e., the identification of vulnerable educational facilities that could be considered suitable candidates for the installation of crowdsourcing sensors, also based on citizen priorities; the aim is to establish a network of citizen science sensors that could cover the gaps left by traditional traffic sensing techniques To do so, spatial analysis is performed by selecting specific criteria and mapping them; a survey is then performed with a pilot sample of students in order to assess the importance of the criteria and derive a comprehensive indicator of vulnerability to transport impacts for each educational facility.
The paper addresses the following research question: how can vulnerable educational facilities be identified and prioritized as candidates for crowdsourced sensor deployment to enhance data collection through citizen science and address data gaps in traditional sources?
The remainder of the paper is organized as follows. The next section presents a literature review on the topic of location-allocation and public involvement. Then, section 3 presents the projects and introduces the case study that will be used to illustrate the method. Section 4 describes the method and its application to the case study of Catania. Finally, Section 5 draws conclusions.
2. LITERATURE REVIEW
The construction of the sensors’ network starts with the choice of facilities in which to allocate them. In our study, we focus on vulnerable educational facilities, with the aim of providing a participatory ranking to determine the best locations for sensor deployment. In general, the problem of the optimal location of traffic sensors is still of interest in the scientific literature. Different models can be proposed, depending on sensor types (e.g., counting sensors, image sensors, Automatic Vehicle Identification (AVI) readers), available a-priori information, and flows of interest (e.g., OD flows, route flows, link flows) [14]. Broadly, sensor location problems are approached using two main methodologies: optimization models and GIS-based (Geographic Information Systems - based) approaches. Optimization models in transportation analysis are particularly valuable for integrating multiple objectives, such as minimizing costs, maximizing service efficiency, or ensuring equitable resource distribution. These models have been employed since the early 2000s (e.g., [15]). In the context of traffic sensor placement, Gentili and Mirchandani [14] introduced the Sensor Location Flow-Observability Problem and the Sensor Location Flow-Estimation Problem. These bilevel problems involve an upper level determining sensor placement and a lower level estimating traffic flows for a given set of candidate locations based on specific evaluation criteria. A more recent work is the one by Salari et al. [16] who introduced two contributing factors in determining the location of sensors, namely the probability of failing to infer link flows on unobserved links due to sensor malfunctions and the impact of sensor failure on link flow inference for unobserved links. These factors were formulated as objective functions using min-max and min-sum approaches, solved through Genetic Algorithms. More recently Firefly Algorithm has been used by Fu et al. [17] to optimize multi-type traffic sensor locations for estimation of multi-period origin-destination demands with covariance effects. In general, Owais [18] provides an extensive review of existing methodologies and applications.
While optimization models provide robust solutions for specific challenges, GIS enhances the understanding of spatial relationships and stakeholder involvement in transportation planning. GIS-based approaches indeed leverage spatial data to analyze and visualize transportation systems, making them particularly effective in understanding the impact of the built environment on travel behavior and accessibility. These approaches are widely used in transportation planning, especially for location selection. Examples are those by Zuluaga et al [19] and Amoroso et al. [20], who applied GIS-based approaches for the cases of bike-sharing station locations and bike parking locations respectively. Giuffrida et al. [7] highlight the role of public participatory GIS in transport decision-making, as it fosters stakeholder engagement and improves the quality of transportation planning outcomes e.g [21]. In particular, spatial multi-criteria analysis using GIS is a powerful tool to evaluate transport solutions while accounting for stakeholder preferences [22]. Moreover, the dynamic nature of transportation systems necessitates continuous updates and assessments, which GIS facilitates through real-time data integration. This capability is particularly useful in citizen science approaches. Due to these intrinsic characteristics of GIS approaches, we decided to adopt a GIS-based method for this study, which aims to involve citizens in the selection process for traffic sensor locations. To the best of the authors' knowledge, this is the first study to use a participatory GIS-based approach for this purpose. The chosen method indeed will be based on the definition of a set of spatial criteria to identify the most vulnerable educational facilities, i.e. our candidates to host the sensors, that will flow in a GIS-based approach. In this paper, the case of Catania will be presented and analyzed. The method is scalable, but specific data are needed to reflect the specificities of the considered case studies.
3. CASE STUDY
Catania is a medium-sized city of about 300,000 inhabitants located in the eastern part of Sicily (Italy). The metropolitan area counts about 700,000 inhabitants who gravitate around the central area of the city and generate the majority of systematic trips. Due to a low public transport supply in the peripheral areas, Catania is a highly congested city, with one of the highest motorization rates in Italy (about 800 cars per 1000 inhabitants), and with a low public transit ridership, low use of micro-vehicles and walking for systematic trips [23].
Schools are one of the most important attractors and generators of private car trips. This is ascribable to the unbalanced distribution of the population (with schools that are often distant from residences), to a lack of proper infrastructures for walking and cycling, and poor public transport provision. The consequence is that the opening and closing time of schools often causes traffic congestion, especially in the areas surrounding the educational facilities.
In 2020, a national law introduced the so called “school zones” (“zone scolastiche”) as urban areas that are close to school facilities, where particular protection for pedestrians and the environment should be guaranteed, delimited along the access roads by appropriate start and end signs. In this respect, since “school zones” should be safe environments for students, access to private cars can be prohibited. This is the case of two schools in Catania that decided to close the street school to vehicles permanently, even if this solution in one case was opposed by some residents, who were not properly involved in the decision and who perceived the intervention as negative, limiting their accessibility. Since each case is specific, and there is no one-size-fits-all solution, it is important to adequately plan interventions in schools, starting from the most vulnerable ones to transport impacts (such as environmental pollution, unsafety, and social exclusion), and to properly involve all stakeholders in this process. The next section will describe the methodology used to select schools according to different criteria.
4. METHODOLOGY AND APPLICATION
In this section, we outline the approach undertaken to evaluate the vulnerability of the educational facilities in order to establish priority schools where to intervene.
The methodology is structured around the following general steps:
- Identification of the study area and facilities
- Selecting criteria to assess the vulnerability of facilities and formulation of an index
- Weighting of the criteria through public consultation
- Application of the methodology to the case study and presentation of the results
We used QGIS software for the spatial analysis. QGIS is a widely used open-source tool that allows for collecting, visualizing and analyzing spatial data and has been used to perform accessibility analysis. Besides, recognizing the importance of community involvement from the project’s beginning, we administered a survey to a pilot sample of students in order to elicit their perspectives and preferences regarding the criteria used for identifying the most vulnerable schools. This allows us to weigh the different criteria and perform a spatial multi-criteria analysis. In this respect, a comprehensive indicator of
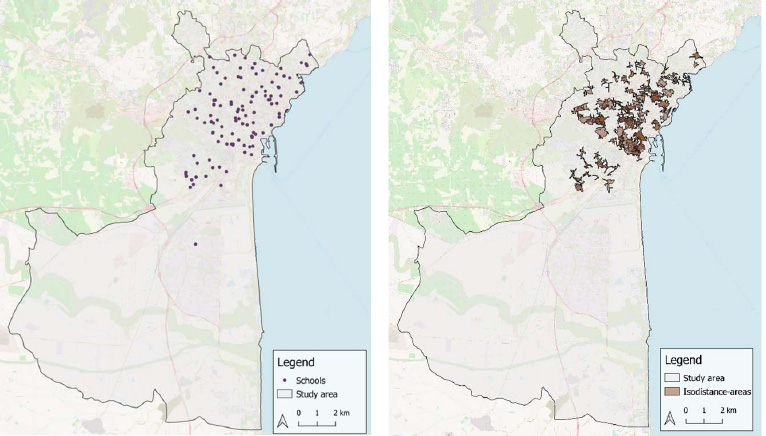
(a) Identification of study area and educational facilities; (b) Isodistance-areas for the educational facilities (own setup).
vulnerability is evaluated, accounting both for the values of criteria and the related weight. To highlight the practicality of our methodology, we will directly present it for the case study of Catania.
4.1. Identification of the Study Area and Facilities
In this step we identified the study area, in order to define the geographical extent under consideration; for our case study, we considered the whole geographic extension of the city of Catania. Locations of educational facilities were obtained from the open data portal of the Metropolitan City of Catania [24] (Fig. 1a).
Isodistances, which represent areas of equal distance from a given point, were used to assess the accessibility of each educational facility. For this analysis, we utilized the HQGIS plugin, a Python-based tool for QGIS that integrates the HERE API. This plugin offers a range of functionalities, including traffic analysis, routing, and geocoding, which allow for the evaluation of accessibility across various transportation modes. The HQGIS plugin is particularly useful as it enables the selection of different travel modes such as walking, cycling, driving, and public transportation, allowing for flexible and accurate spatial analysis. In our study, we focused on a 500-meter radius around each educational facility, considered as a proper walking distance, and selected “pedestrian” as the travel mode, as this reflects the most relevant and common mode of transport for students, particularly in urban environments where walking is often the primary mode for short trips. (Fig. 1b).
4.2. Selecting Criteria to Assess the Vulnerability of Facilities and Index Formulation
We identified four different criteria to assess the vulnerability of facilities, namely Traffic Volume, Green Areas/Spaces, Active Mobility Infrastructure, and Safety. The choice of the main criteria is based on a literature review analysis. In particular, the study by Macedo et al. [25] reports different factors affecting active school travel, considering personal characteristics, external exposures (e.g. traffic accidents), design (e.g. green area cover, speed of traffic), diversity (land use mix), and density (e.g. street network density). Similarly, Larsen et al. [26] analyzed the built environment and traffic environment data and found out that traffic is a significant factor related to student mode choice.
The criteria were characterized and populated by data as follows:
4.2.1. Traffic Volume (T)
We used the traffic volume of private vehicles during peak hours (veh/h) as in the road network model of the General Urban Traffic Plan of the city of Catania [27]; this criteria is representative of both safety and environmental impacts, since more traffic increases both pollution and accidents.
| Criteria | Data and Unit | Contribution to Vulnerability | Source | Feature Type |
|---|---|---|---|---|
| Traffic Volume T | Veh/h in peak hour | + | PGTU Catania, 2013 | Lines |
| Green Spaces G | Number of green spaces | - | OSM | Areas/Points |
| Active Mobility Infrastructure A | Presence of pedestrian facilities | - | OSM | Lines |
| Active Mobility Infrastructure A | Number of squares | - | OSM | Areas/Points |
| Active Mobility Infrastructure A | Presence of cycleways | - | OSM | Lines |
| Active Mobility Infrastructure A | Number of bike racks/parking facilities | - | OSM | Points |
| Safety S | Number of accidents | + | Catania municipality (2017) | Points |
4.2.2. Green Areas/Spaces (G)
We extracted data from OpenStreetMap (OSM) using the QuickOSM plugin within the QGIS software. QuickOSM plugin allows to download data directly from OSM, using specific keys and values to extract them for a particular area; in this case, we used the key “leisure” and the value “park” for the area of the whole city of Catania; this criterion represents both social and environmental concerns, due to the fact that more green areas might constitute places where social activities can occur and, at the same time, reduce the negative impacts of pollution.
4.2.3. Active Mobility Infrastructure (A)
Again, we extracted data from OpenStreetMap using the QuickOSM plugin within the QGIS software. In this case, we used several keys and values. More in detail, to retrieve information on pedestrian facilities we used the key “highway” and the value “pedestrian”; moreover we adopted the key “place” and the value “square” to obtain the location of public squares. We also included facilities related to cycling; hence, we used the key “highway” and the value “cycleway” to retrieve data on the presence of cycling infrastructure and the key “amenity” and the value “bicycle parking” for data on bike racks and parking facilities. This criteria is representative of social issues, both in terms of safety and sociality.
4.2.4. Safety (S)
This indicator concerns the unsafety of the surroundings. Data on accidents were sourced from the OpenData section of the Catania municipality website, and they refer to the year 2017. Each accident is identified by an ID, occurrence date, and address for localization. To spatially reference these accidents in QGIS, we converted their addresses into geographic coordinates using the geocoding functionality of MMQGIS, a Python plugin for QGIS.
A summary of the data used is presented in Table 1, including the source and the GIS feature type.
Once the data were collected, the following steps involved the coupling between the data and the isodistance for each school. This was done using an intersect procedure for line features; more in detail, in the case of T the value of veh/h was associated with each isodistance; while, in the case of pedestrian and cycling facilities, the isodistances were assigned with a value corresponding to the number of facilities within the area. Finally, in the case of areal features, a centroid was assigned to each element and then the “Count points in polygons” procedure in QGIS was used to perform the coupling. After the data and isodistances were coupled, the A criterion was computed as the sum of all the data. A normalization procedure adopting the min-max method was then applied to adjust the values of the criteria (T, G, A, S) to normalized values (Tn, Gn, An, Sn) on a common scale from 0 to 1, where 0 represents the worst value and 1 represents the best value.
The Vulnerability Index (VI) for each isodistance i (and, consequently, for each school) is given by a linear combination of the different normalized criteria j, each weighted by wj, the specific weights assigned to each criterion. These weights are determined through a participatory procedure involving stakeholders and other relevant actors. VI is computed according to the following equation:
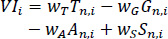 |
(1) |
In the following section, a pilot assessment of the weighting criteria is presented.
4.3. Weighting of the Criteria through Public Consultation
A pilot study was conducted to develop a test database for weighting the criteria. Students from a high school located in the city center of Catania participated in a survey designed to understand their mobility habits and elicit their opinions and preferences regarding school trips and the surrounding school zones. The survey took place in March 2023 during an awareness campaign promoting walking and 16 students completed the questionnaire. The survey included two key questions to evaluate the importance of the criteria:
- What are the main issues of the street where your school is located?
- How would you envision the surroundings of your school?
The first question offered respondents the opportunity to could select from options such as “Traffic”, “Pollution”, “Inadequate road conditions”, “Safety” and “other”, with the possibility to choose multiple answers. The second
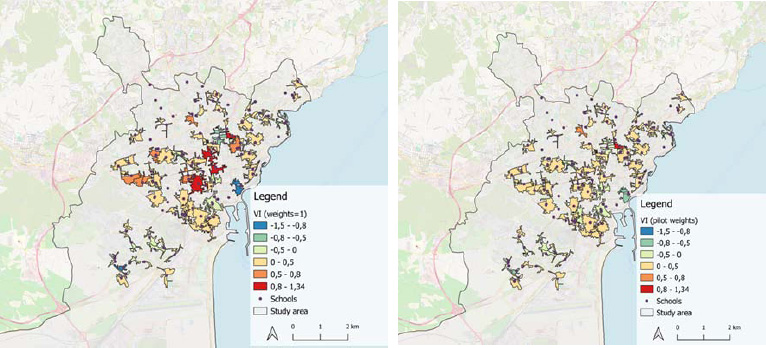
Results of VI for the case study (a) all weights = 1; (b) weights deriving from the pilot experience (own setup).
question was open-ended, allowing students to freely express their ideas. In order to determine the weights for the criteria, we counted the times each topic was mentioned in the students’ responses and normalized these counts on a scale from 0 to 1, as shown in Table 2.
| Associated Words | Times Cited | Weight | Value |
|---|---|---|---|
| Traffic | 17 | wT | 1.00 |
| Green, Pollution | 10 | wG | 0.59 |
| Equipped infrastructure, Proper Infrastructure | 8 | wA | 0.47 |
| Safety | 5 | wS | 0.29 |
5. RESULTS AND DISCUSSION
We applied equation 1 to the case study; with the results illustrated in the maps shown in Fig. (2). The maps depict the Vulnerability Index (VI) calculated using two approaches: one with all weights set to 1 (Fig. 2a) and another incorporating the weights derived from the pilot study (Fig. 2b).
In general, isodistances presenting negative values of VI can be considered with low vulnerability, while those with positive values of VI indicate areas with high critical issues; the higher the VI, the greater the vulnerability of the facility. Observing the two maps of Fig. (2) one can notice that most of the schools exhibit vulnerabilities. Specifically, Fig. (2a) shows that the most vulnerable facilities are those located in the city center, whereas schools with the least critical issues are located in the southeast and southwest of the city. The application of the weights narrows the gap between the scores obtained by the schools, allowing some of the facilities to emerge in comparison to others. As can be noticed in Fig. ( 2b), there is one “red” school with a higher value of VI, which is a secondary school located in a single-lane single-direction street with parking lots at both sides, poor pedestrian infrastructures, and high traffic volumes. Other schools in the same area face similar challenges. The incorporation of stakeholder-derived weights significantly influenced the outcomes of the VI computation, highlighting the importance of accounting for community perspectives in the decision-making process, one of the pillars of the BEC2SCHOOL project. However, it is important to highlight that stakeholder engagement is resource-intensive; in our pilot, the relatively small number of participants—16 high school students—may have introduced biases that could affect the generalizability of the results. Expanding participation to include diverse groups, such as parents, teachers, and local residents, would likely provide a more comprehensive view of priorities. However, these preliminary results can be helpful in making a preliminary assessment of the areas and facilities where it is necessary to intervene and represent the first step to identifying priority schools where to install sensors and start co-creation processes. Other analyses should be performed to understand the willingness of schools, residents and other stakeholders to be involved in co-creation processes.
CONCLUSION
Educational facilities are among the most vulnerable places in cities, being experienced by children and young students. Vulnerable schools, particularly those in high traffic or poorly equipped areas, represent not only a risk to students but also a potential focal point for improving neighbourhood wide accessibility and safety. The streets surrounding facilities can be heavily congested, especially during the school opening and closing hours, thus causing traffic externalities. Students and citizens can be empowered with traffic and environmental data and can become the main players in sustainable changes. This is the aim of the BEC2SCHOOL project that has recently started and will foster co-creation processes in schools. The first step of the project, i.e. a spatial analysis to identify priority areas and facilities where to intervene, is presented in the paper. Important criteria were selected and assessed via a public consultation. The methodology is applied to the case of Catania, one of the two Italian cities that represent the case studies of the project, and a pilot test with students is performed in order to understand their priorities. Results show that traffic is perceived by students as the most important critical issue and that there are many schools, especially in central areas, that show a medium-high level of vulnerability according to the selected criteria. Expanding the sample size involved in the survey and diversifying the participant demographics will indeed be a critical next step in our research agenda. However, it is worth noticing that involving students ensures that traditionally underrepresented voices are considered in decision making. By conducting more extensive surveys involving different age groups and types of schools, we aim to gather more robust data that can inform policy and practice effectively. Finally, expanding the scope of analysis to include additional factors, such as socio-economic conditions, could enhance the comprehensiveness of the framework.
Results pave the way for further analyses aimed at refining the methodology and selecting the most suitable facilities where to install traffic and environmental sensors and foster co-creation processes. The methodology is designed with replicability in mind, offering a framework that can be adapted and implemented in diverse educational settings and contexts. This adaptability allows the approach to be scaled and customized according to the specific needs of different communities, with the aim of engaging citizens in urban planning and decision-making processes, ultimately fostering more sustainable and responsive urban mobility solutions.
AUTHOR’S CONTRIBUTION
N.G., M.L.P.: Study conception and design; N.G., M.L.P.: Data collection; N.G., M.L.P.: Analysis and interpretation of results; N.G., M.L.P.: Draft manuscript. All authors reviewed the results and approved the final version of the manuscript under the heading of Author Contribution.
LIST OF ABBREVIATIONS
| AVI | = Automatic Vehicle Identification |
| OSM | = Open Street Map |
| VI | = The Vulnerability Index |
AVAILABILITY OF DATA AND MATERIALS
All the data and supporting information is provided within the article.
CONFLICT OF INTEREST
Dr. Giuffrida and Dr. Michela Le Pira are the Editorial Advisory Board members of the journal The Open Transportation Journal.
ACKNOWLEDGEMENTS
The paper was developed within the project “Building Empowerment and Community Concerns via transport sensors in SCHOOLs” (unique project codes: D53D23020010001 and E53D23018990001) under the programme “PRIN 2022 PNRR” financed by the “Piano nazionale di ripresa e resilienza (PNRR) —M4C2, investimento 1.4” – European Union—NextGenerationEU”.